Beyond the spreadsheet.
Innovative Tools for External Engagement Data Management in Medical Affairs
Case Study
At a glance
The operations of pharmaceutical companies are heavily regulated, especially when it comes to engagements with patients and experts. How might our client, a Top 10 Pharma, adhere to regulations in its engagements with external experts, while still leveraging the outcomes both for knowledge sharing and management oversight?
Client
Top 10 Pharma
Sector
Life Sciences
Project
Automated reporting dashboard
Activities
Strategy
User research
Personas
Wireframing
Prototyping
Data visualization
Project management
Technologies
Miro
Figma
Logistics in place, but knowledge management missing
Pharmaceutical companies do a lot of external engagements. These are various types of conversations with a wide set of key stakeholders, from patients through doctors to researchers. While this may sound harmless enough, it is anything but. Regulations around these types of activities are strict, the risks are plenty, and the potential fines are high. The hundreds of annual engagements and hundreds of global experts add to the complexity.
There are obviously many logistical elements, like maintaining a list of approved experts, tracking potential conflicts, handling contracts, etc. Our client had all this under control with a system they gradually developed over the past years.
But as big a challenge as logistics sounds, it’s really only paperwork. There were two other crucial factors: management oversight and knowledge sharing. And here, the situation was dire – our client was drowning in data, and at the same time thirsty for knowledge.
- Regional managers had no oversight on activities in their areas, leaving them in the dark
- Executive management was relying on randomized questionnaires to collect information, providing an unreliable and incomplete view
- The interface for extracting data from the logistics system was complex and complicated, the outputs close to undecipherable
- The knowledge gained from the engagements was unsearchable and scattered across various systems
- Metadata to sort and filter the many years of knowledge was locked in PDFs, scanned documents, and local repositories
From tactical temporary guides to strategic core members
Our involvement can be divided into three stages.
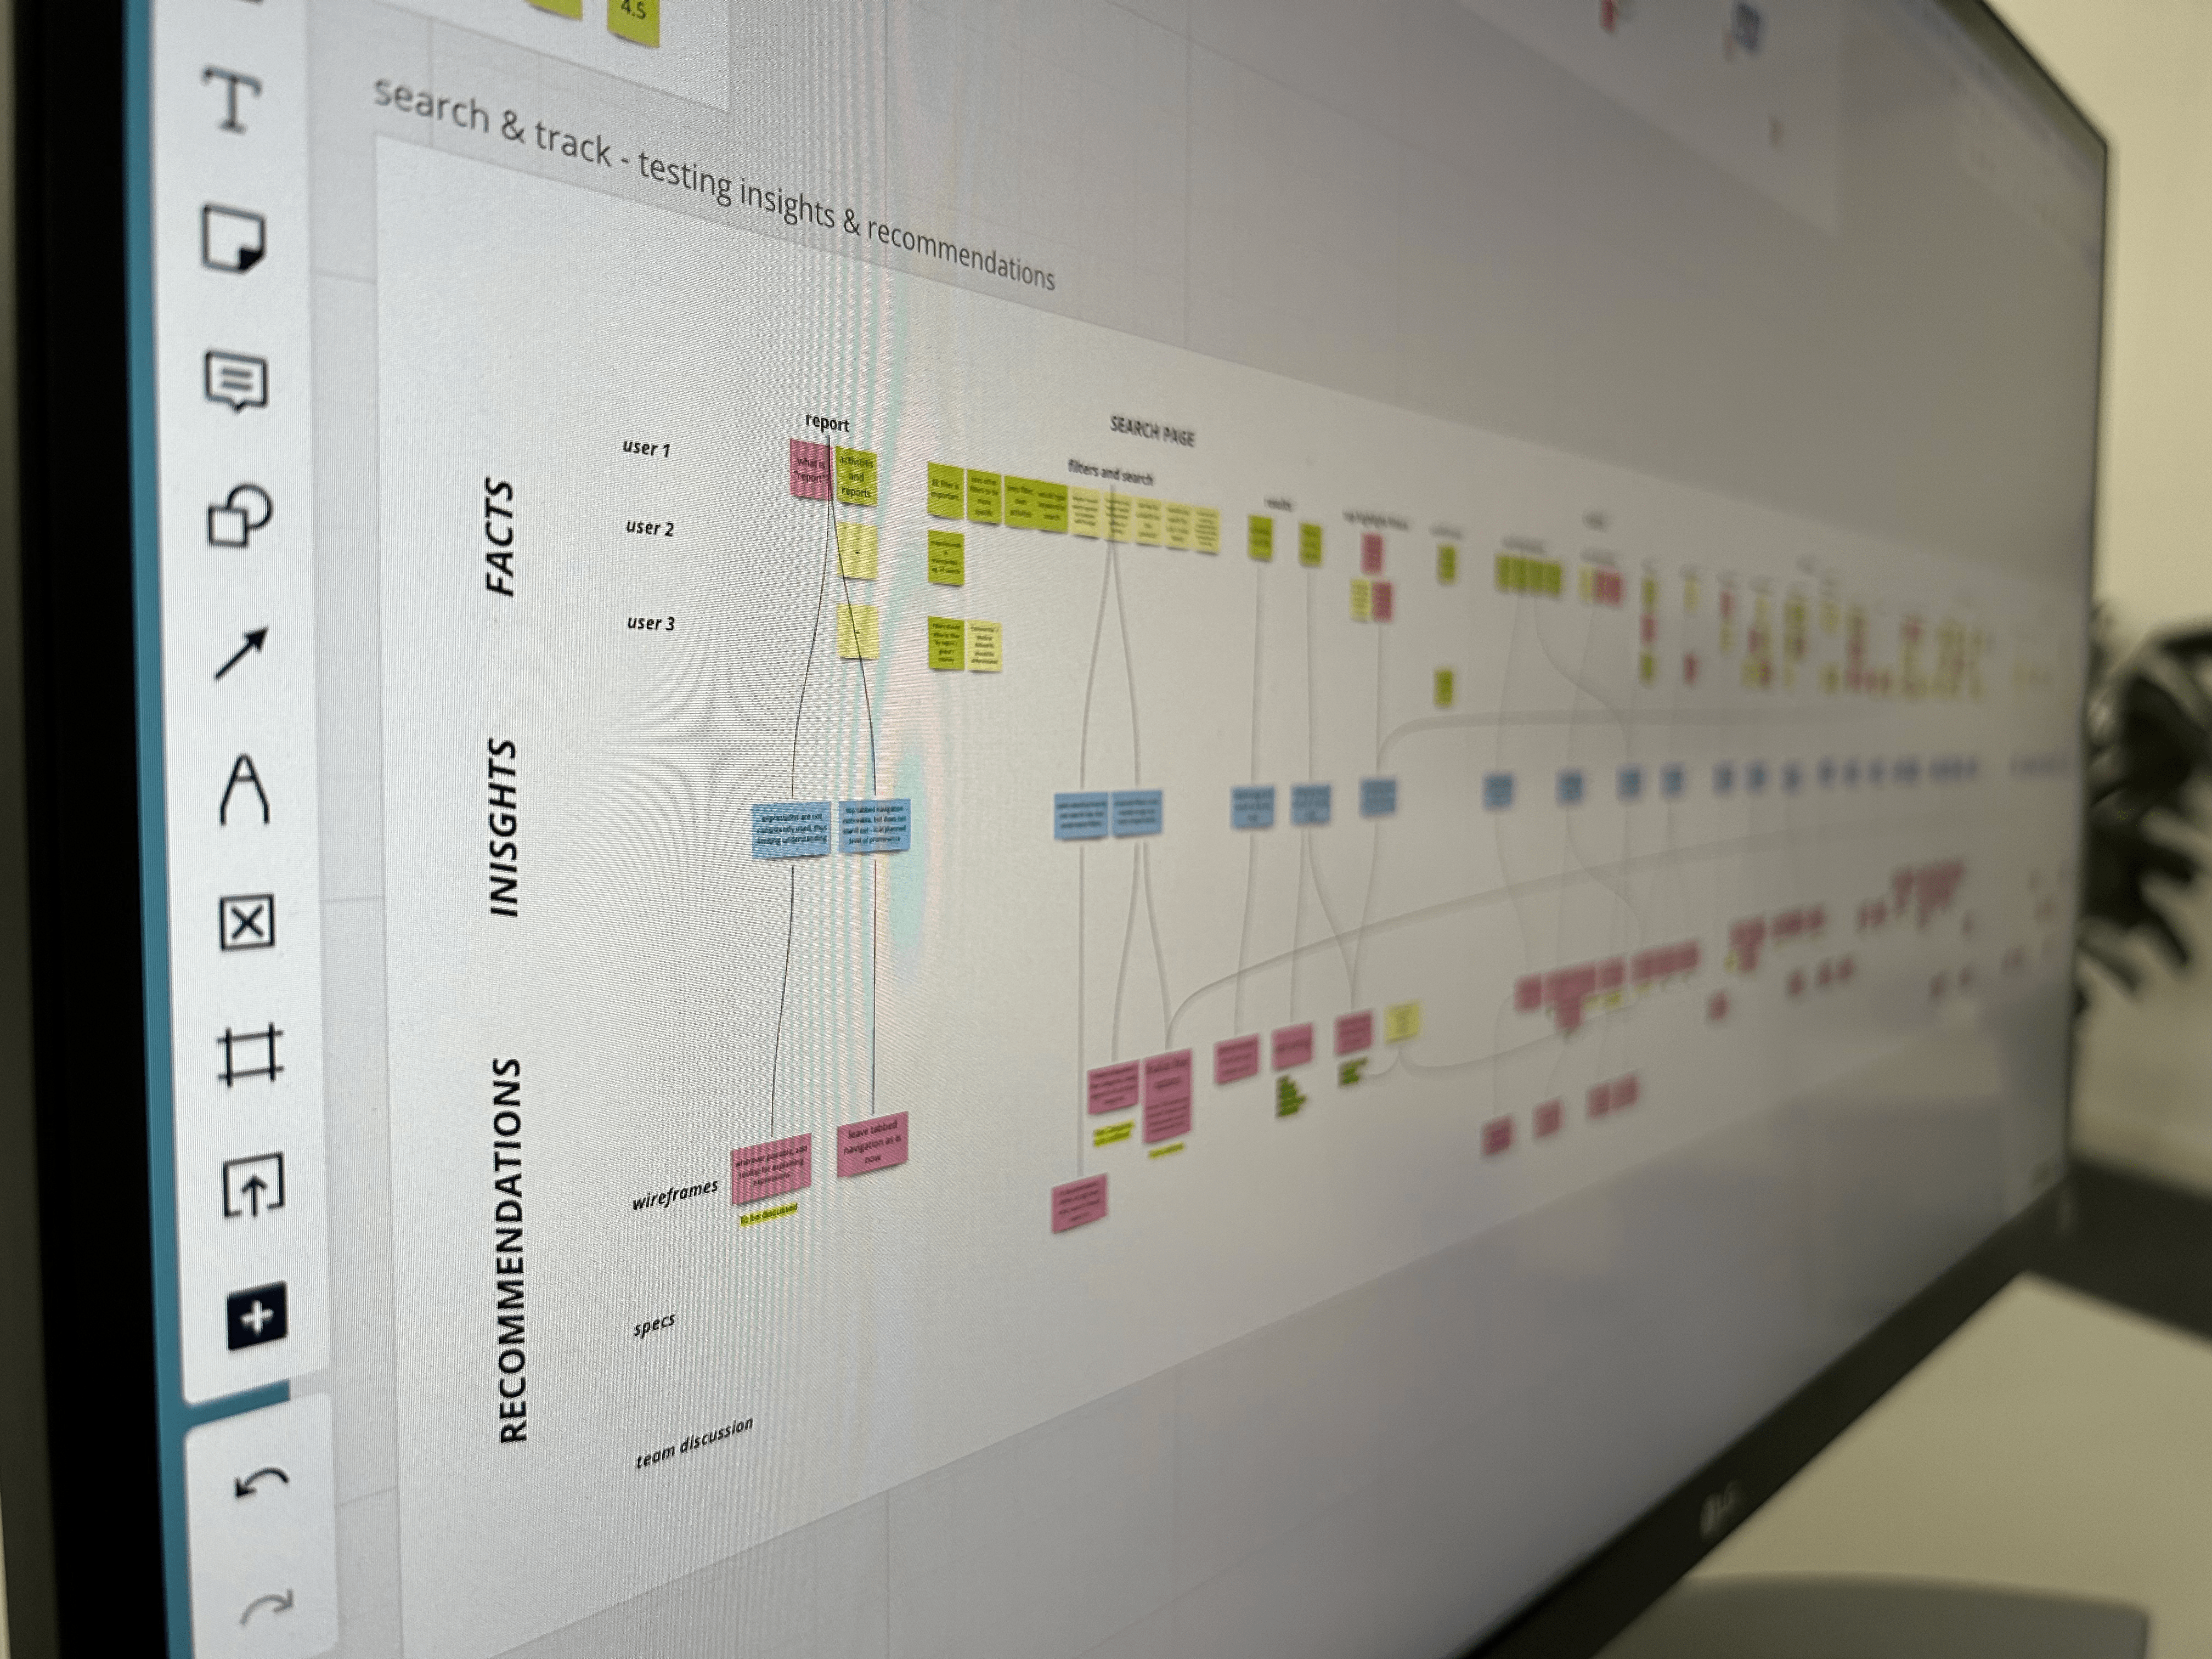
In the first stage, we were guides. An internal working team was already set up on the client’s side, consisting of experts from various fields. Whitespace was first called in to add a human-centered lens and a structured process to their efforts. We helped define personas, and embed them in the project processes in practical and meaningful ways. We designed and conducted research, and compiled findings in a usable way. During these early weeks, we became so vital to the project that we were requested to stay involved.
In the second stage, we were consultants. Here we worked towards two main deliverables:
- An interface vision, which shows what future oversight and knowledge-sharing scenarios could look like
- And a feasibility document, that paired this with opportunities and challenges of the wider technical ecosystem
Here we faced an unexpected challenge. People didn’t actually know what they need. Both management and users were so used to the archaic as-is situation that they couldn’t articulate specific needs, or image a to-be future. As they were left in the dark regarding knowledge and information for so long, any light was deemed helpful.
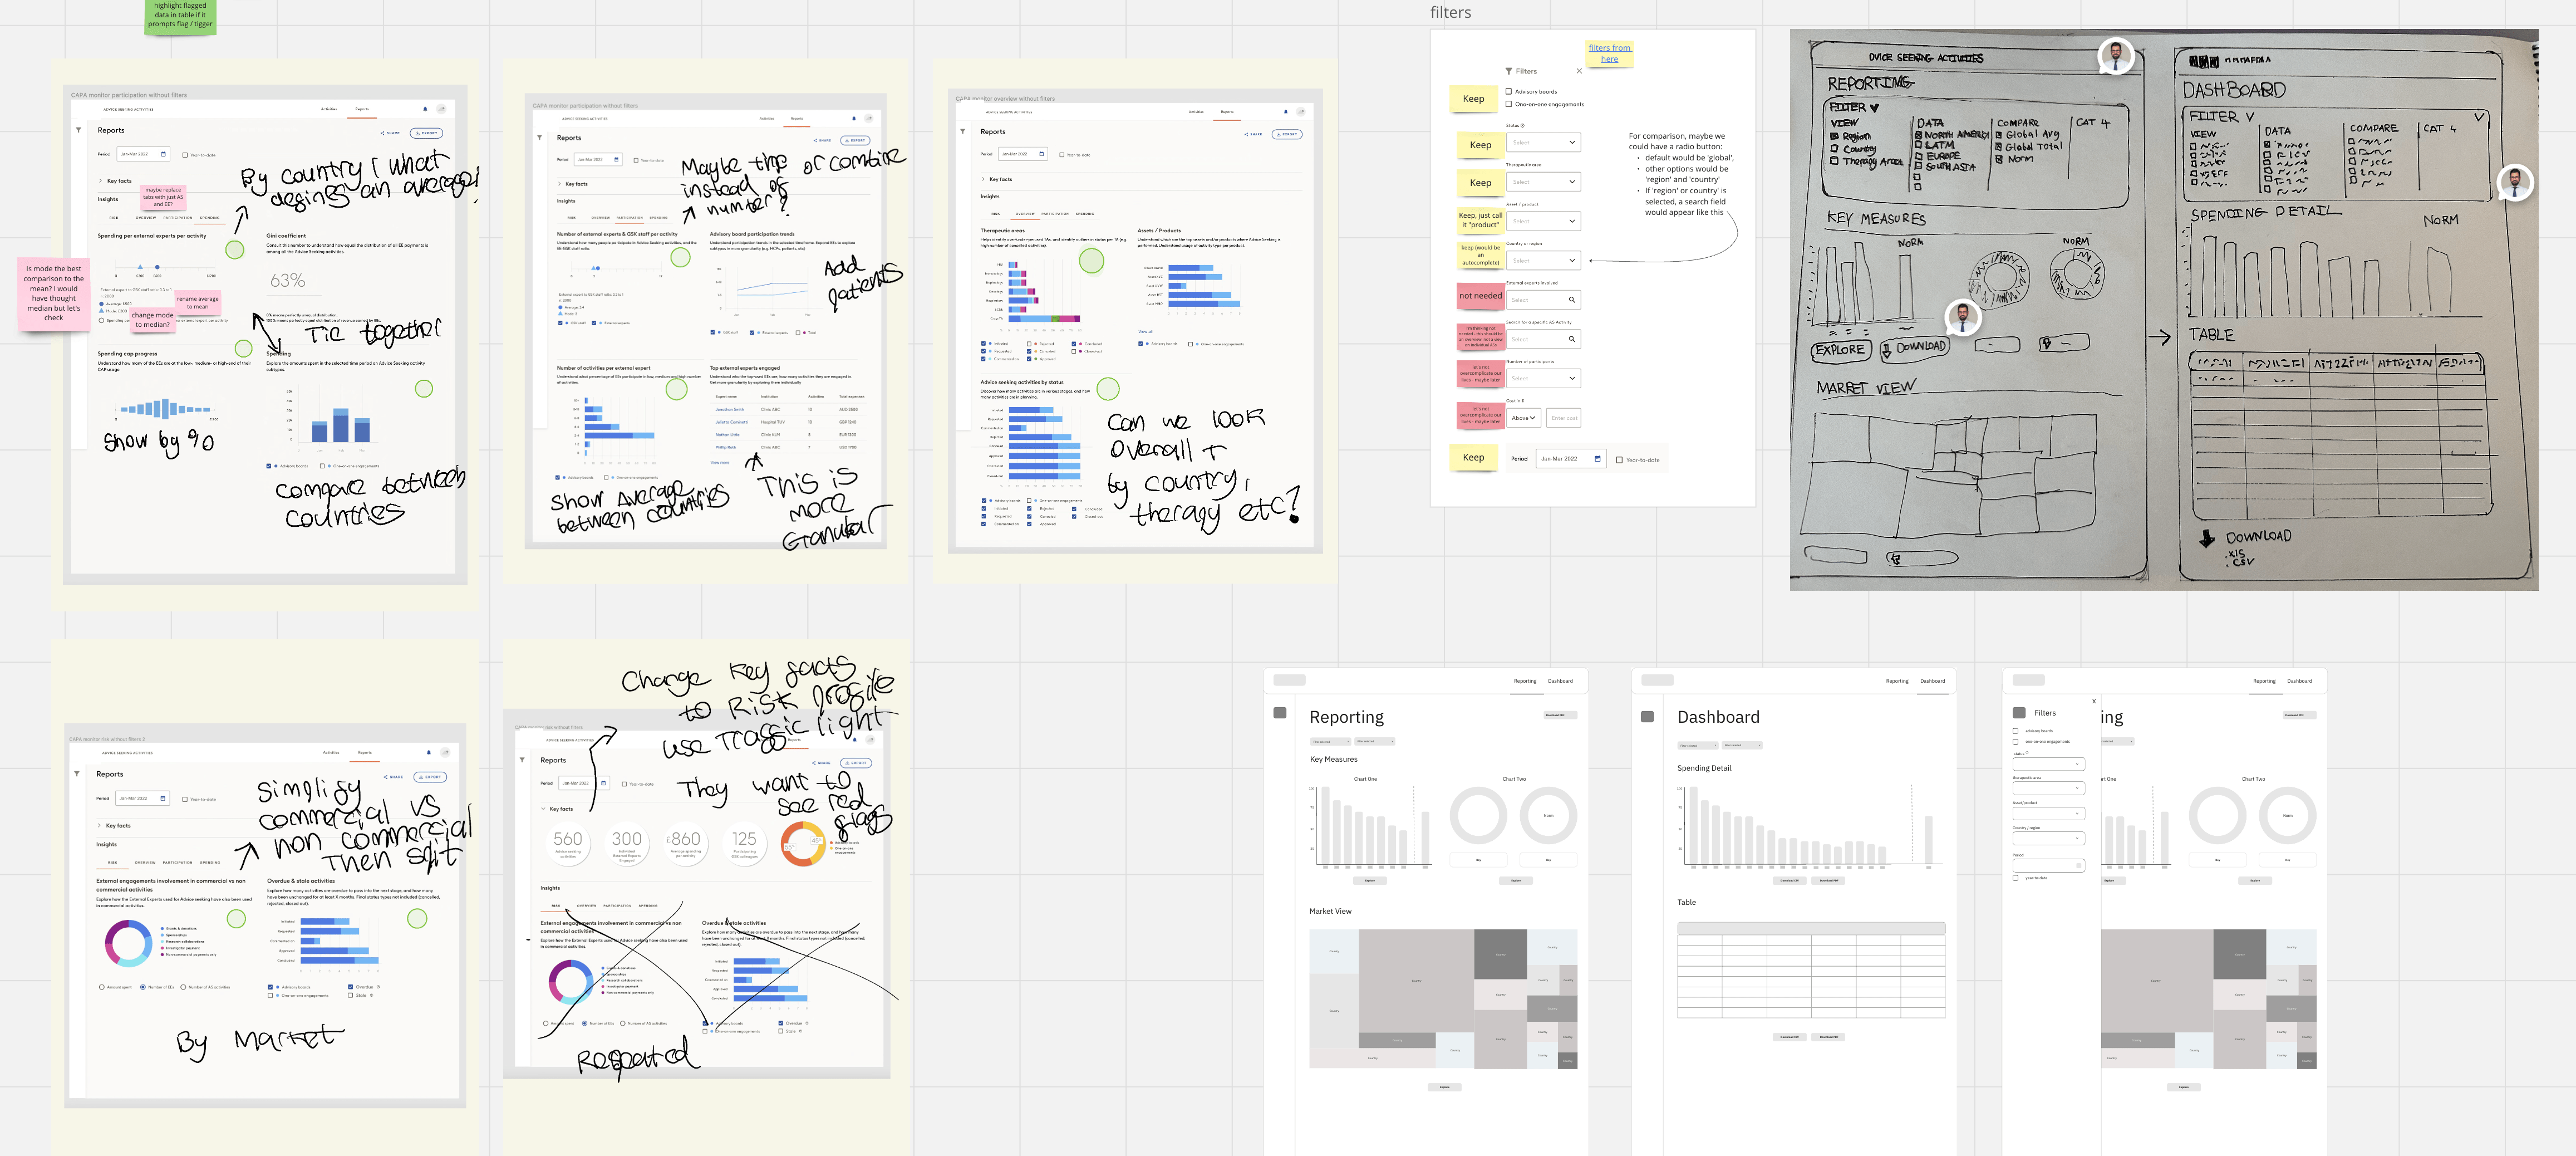
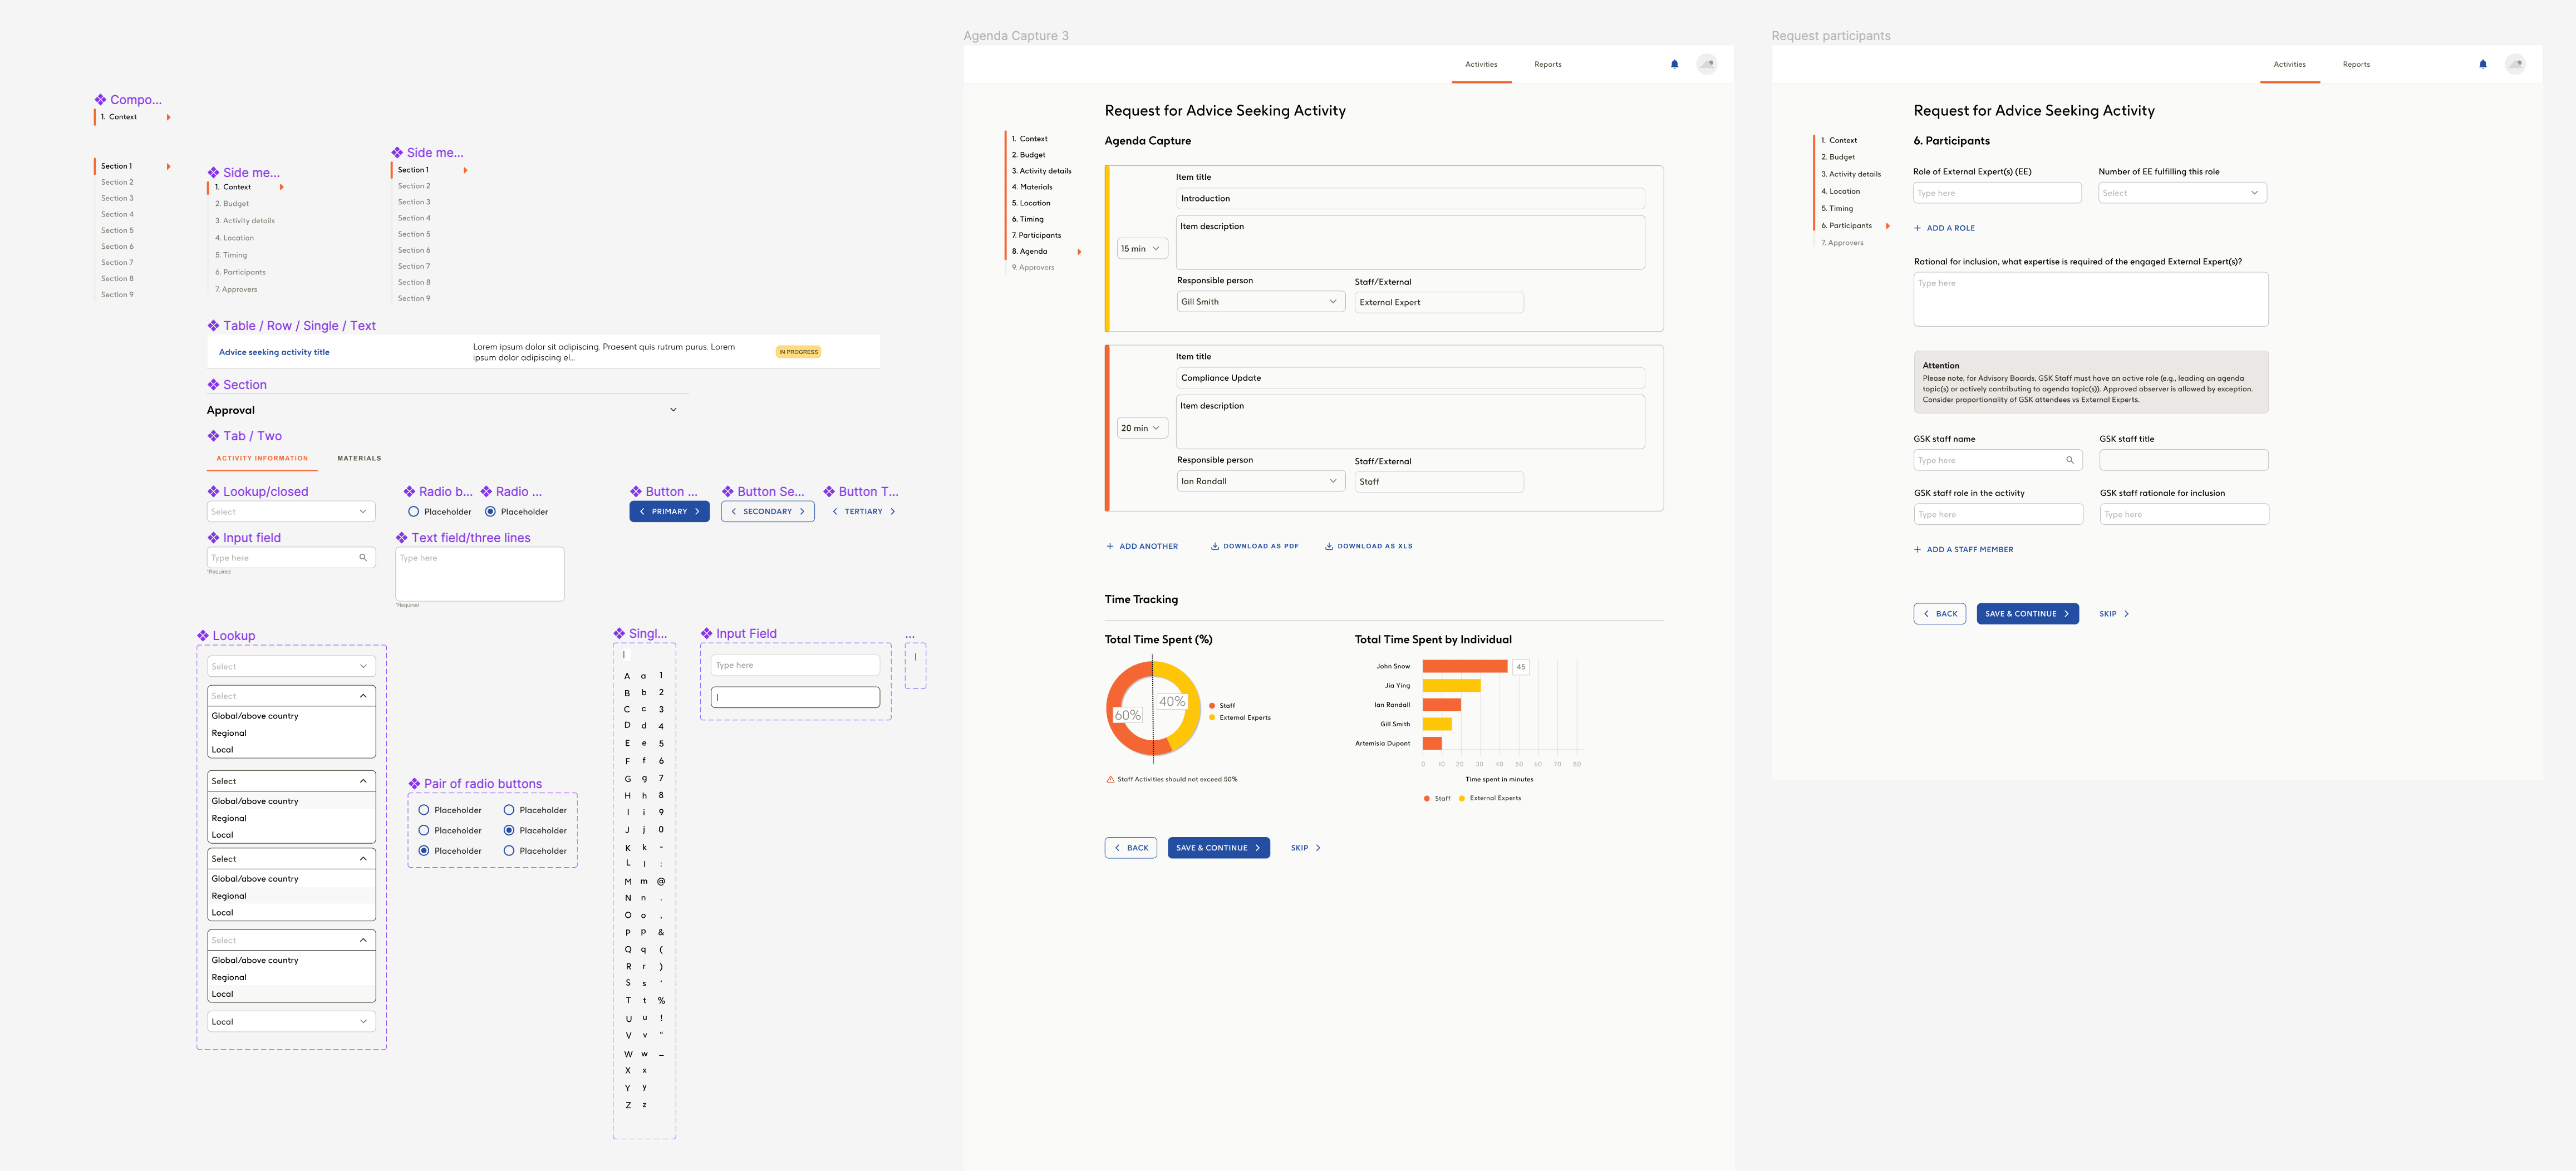
To pry out the biggest needs, we created mockups based on our domain expertise and data visualization skills, tested these in multiple rounds with a wide set of users, and iterated after each round. In the end, we arrived at a vision that wowed internal audiences, which brought us to the next phase, where our involvement grew further. In the third stage, we were part of the core team.

I just want to say it's an excellent piece of work and thank you very much for progressing it […] I think it's wonderful […] and I think it's thanks to the great team behind it.
Global Medical Affairs Standards Director

From plans to actions
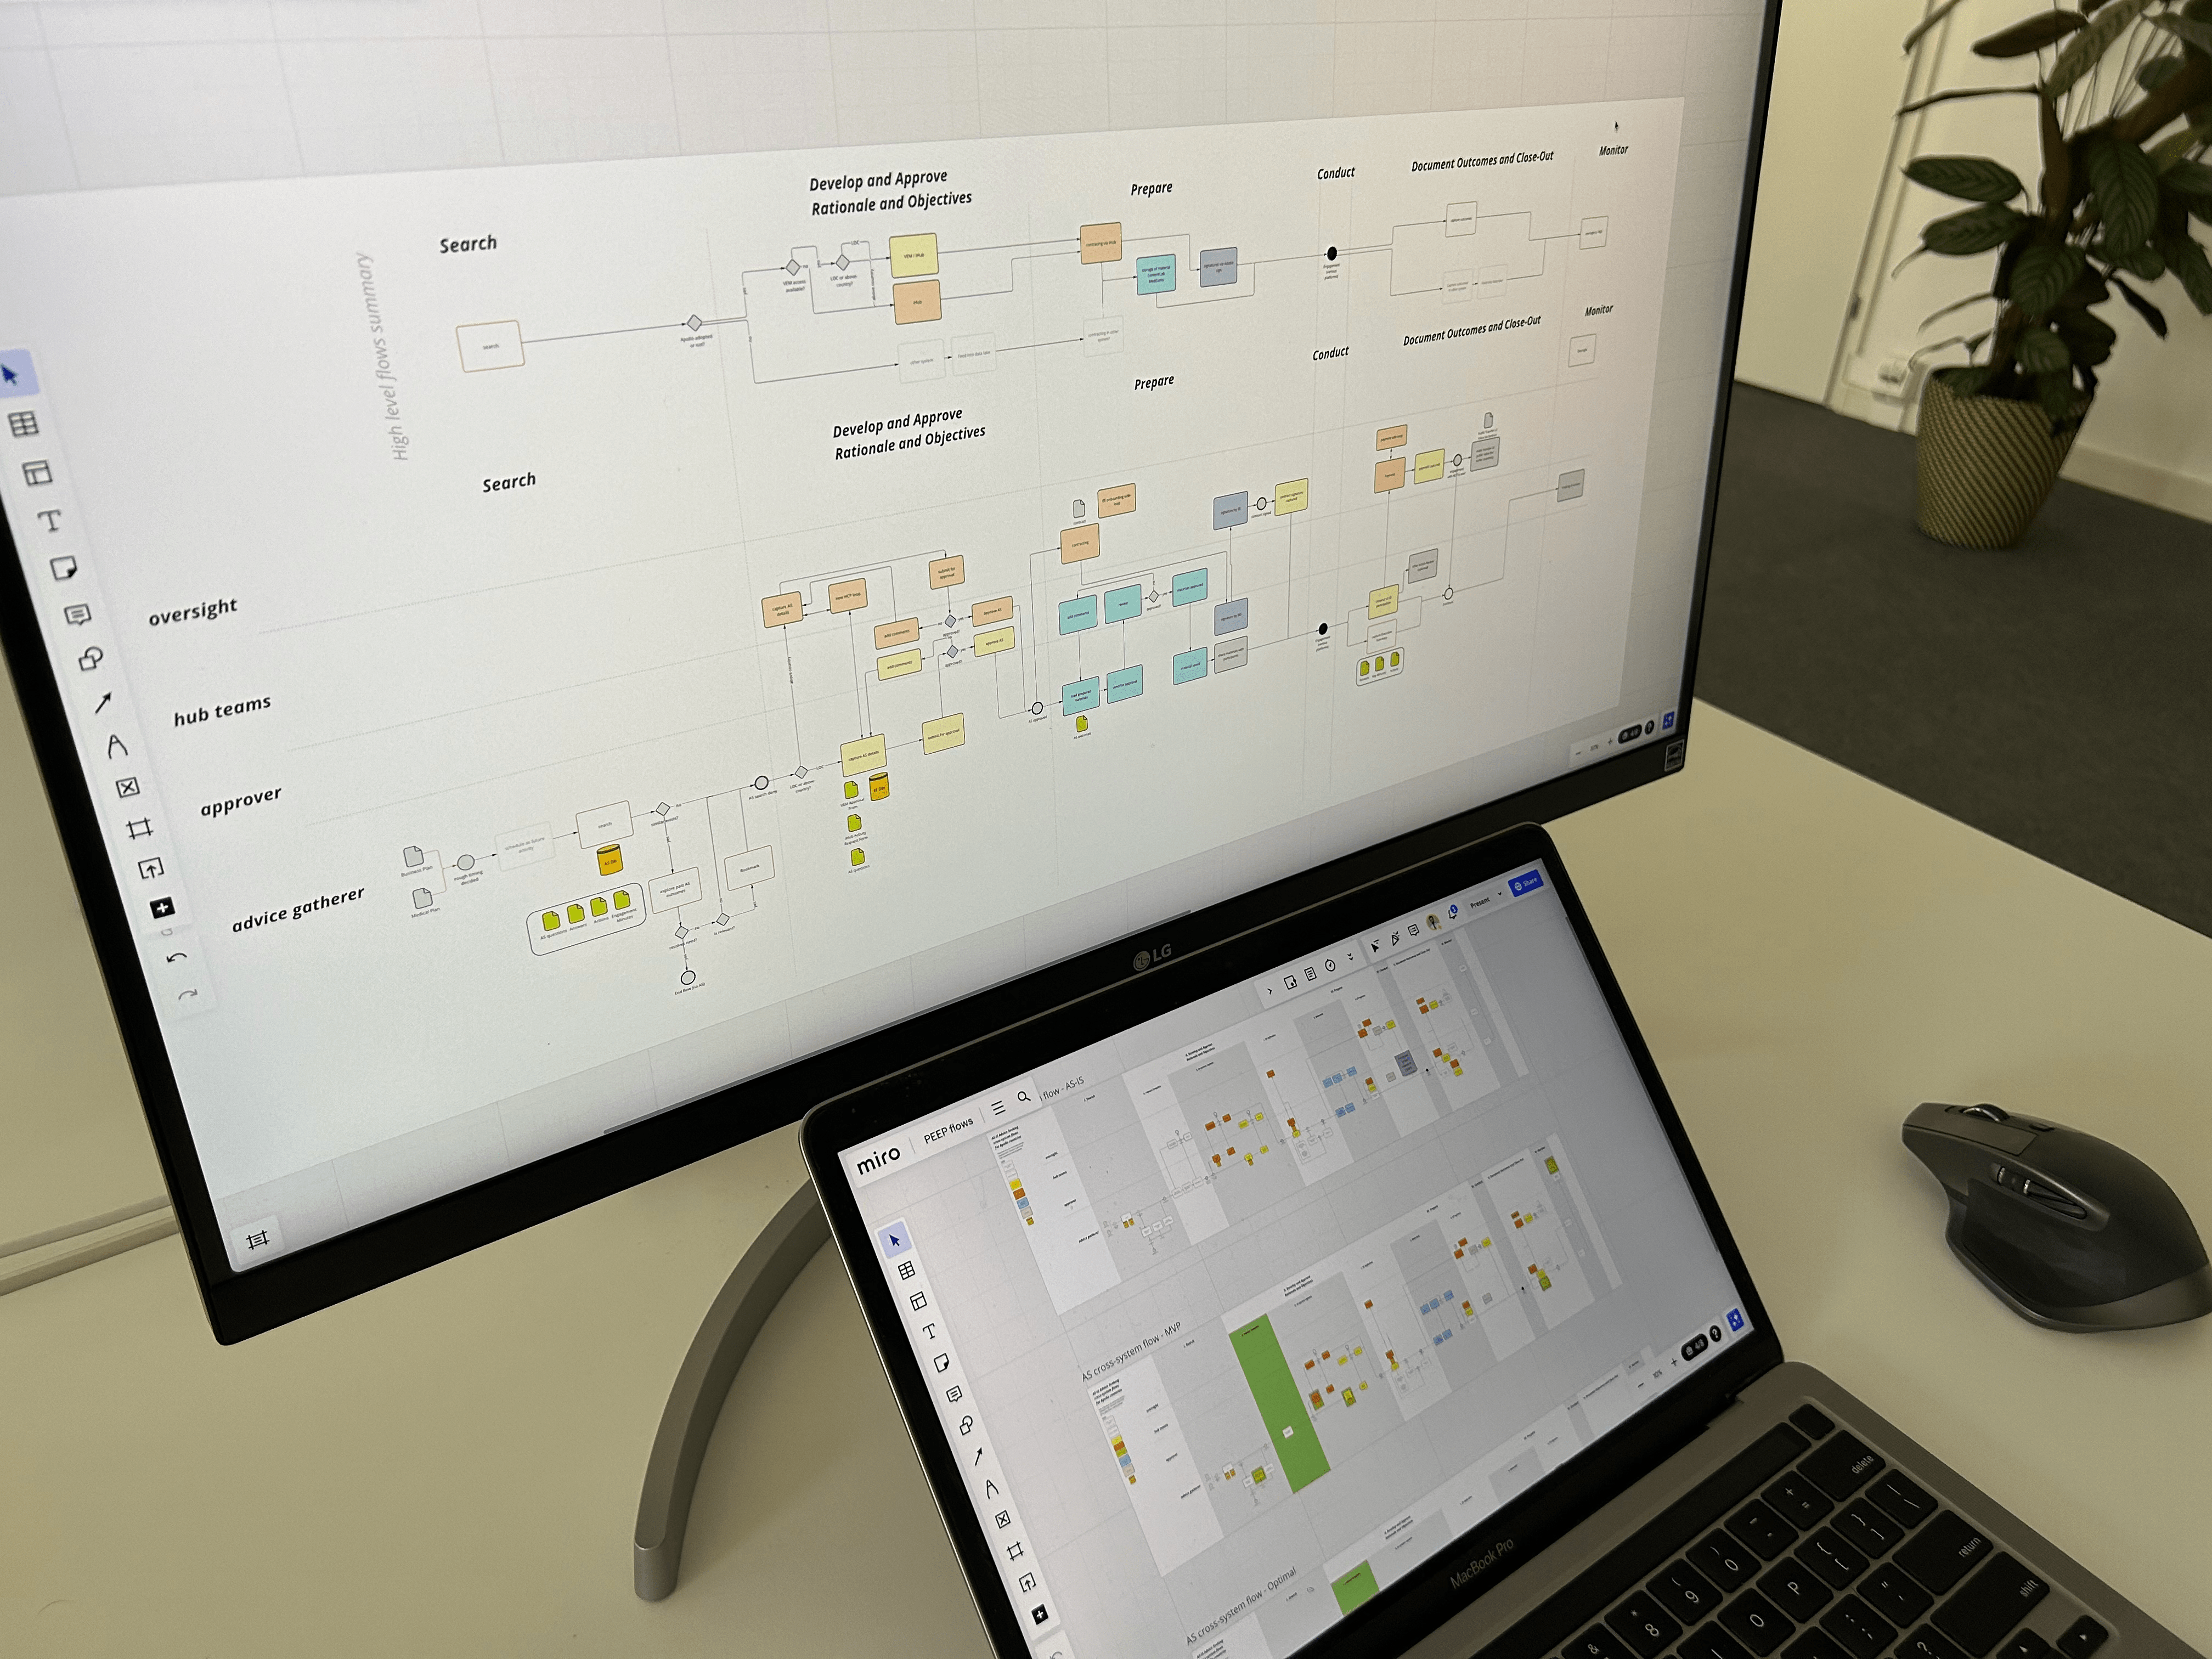
The third stage was all about translating the high-level strategy into detailed deliverables. Here Whitespace experts from strategy, technical, and design fields worked with various technical client teams while maintaining a focus on the end-users in a data-heavy environment. We became the glue that held the various efforts connected and drove the project both on a tactical and strategic level.
Building on the vision and feasibility deliverables, in this stage we really got our hands dirty. One great example of this was connecting business needs with available data and user-centricity. We did this by:
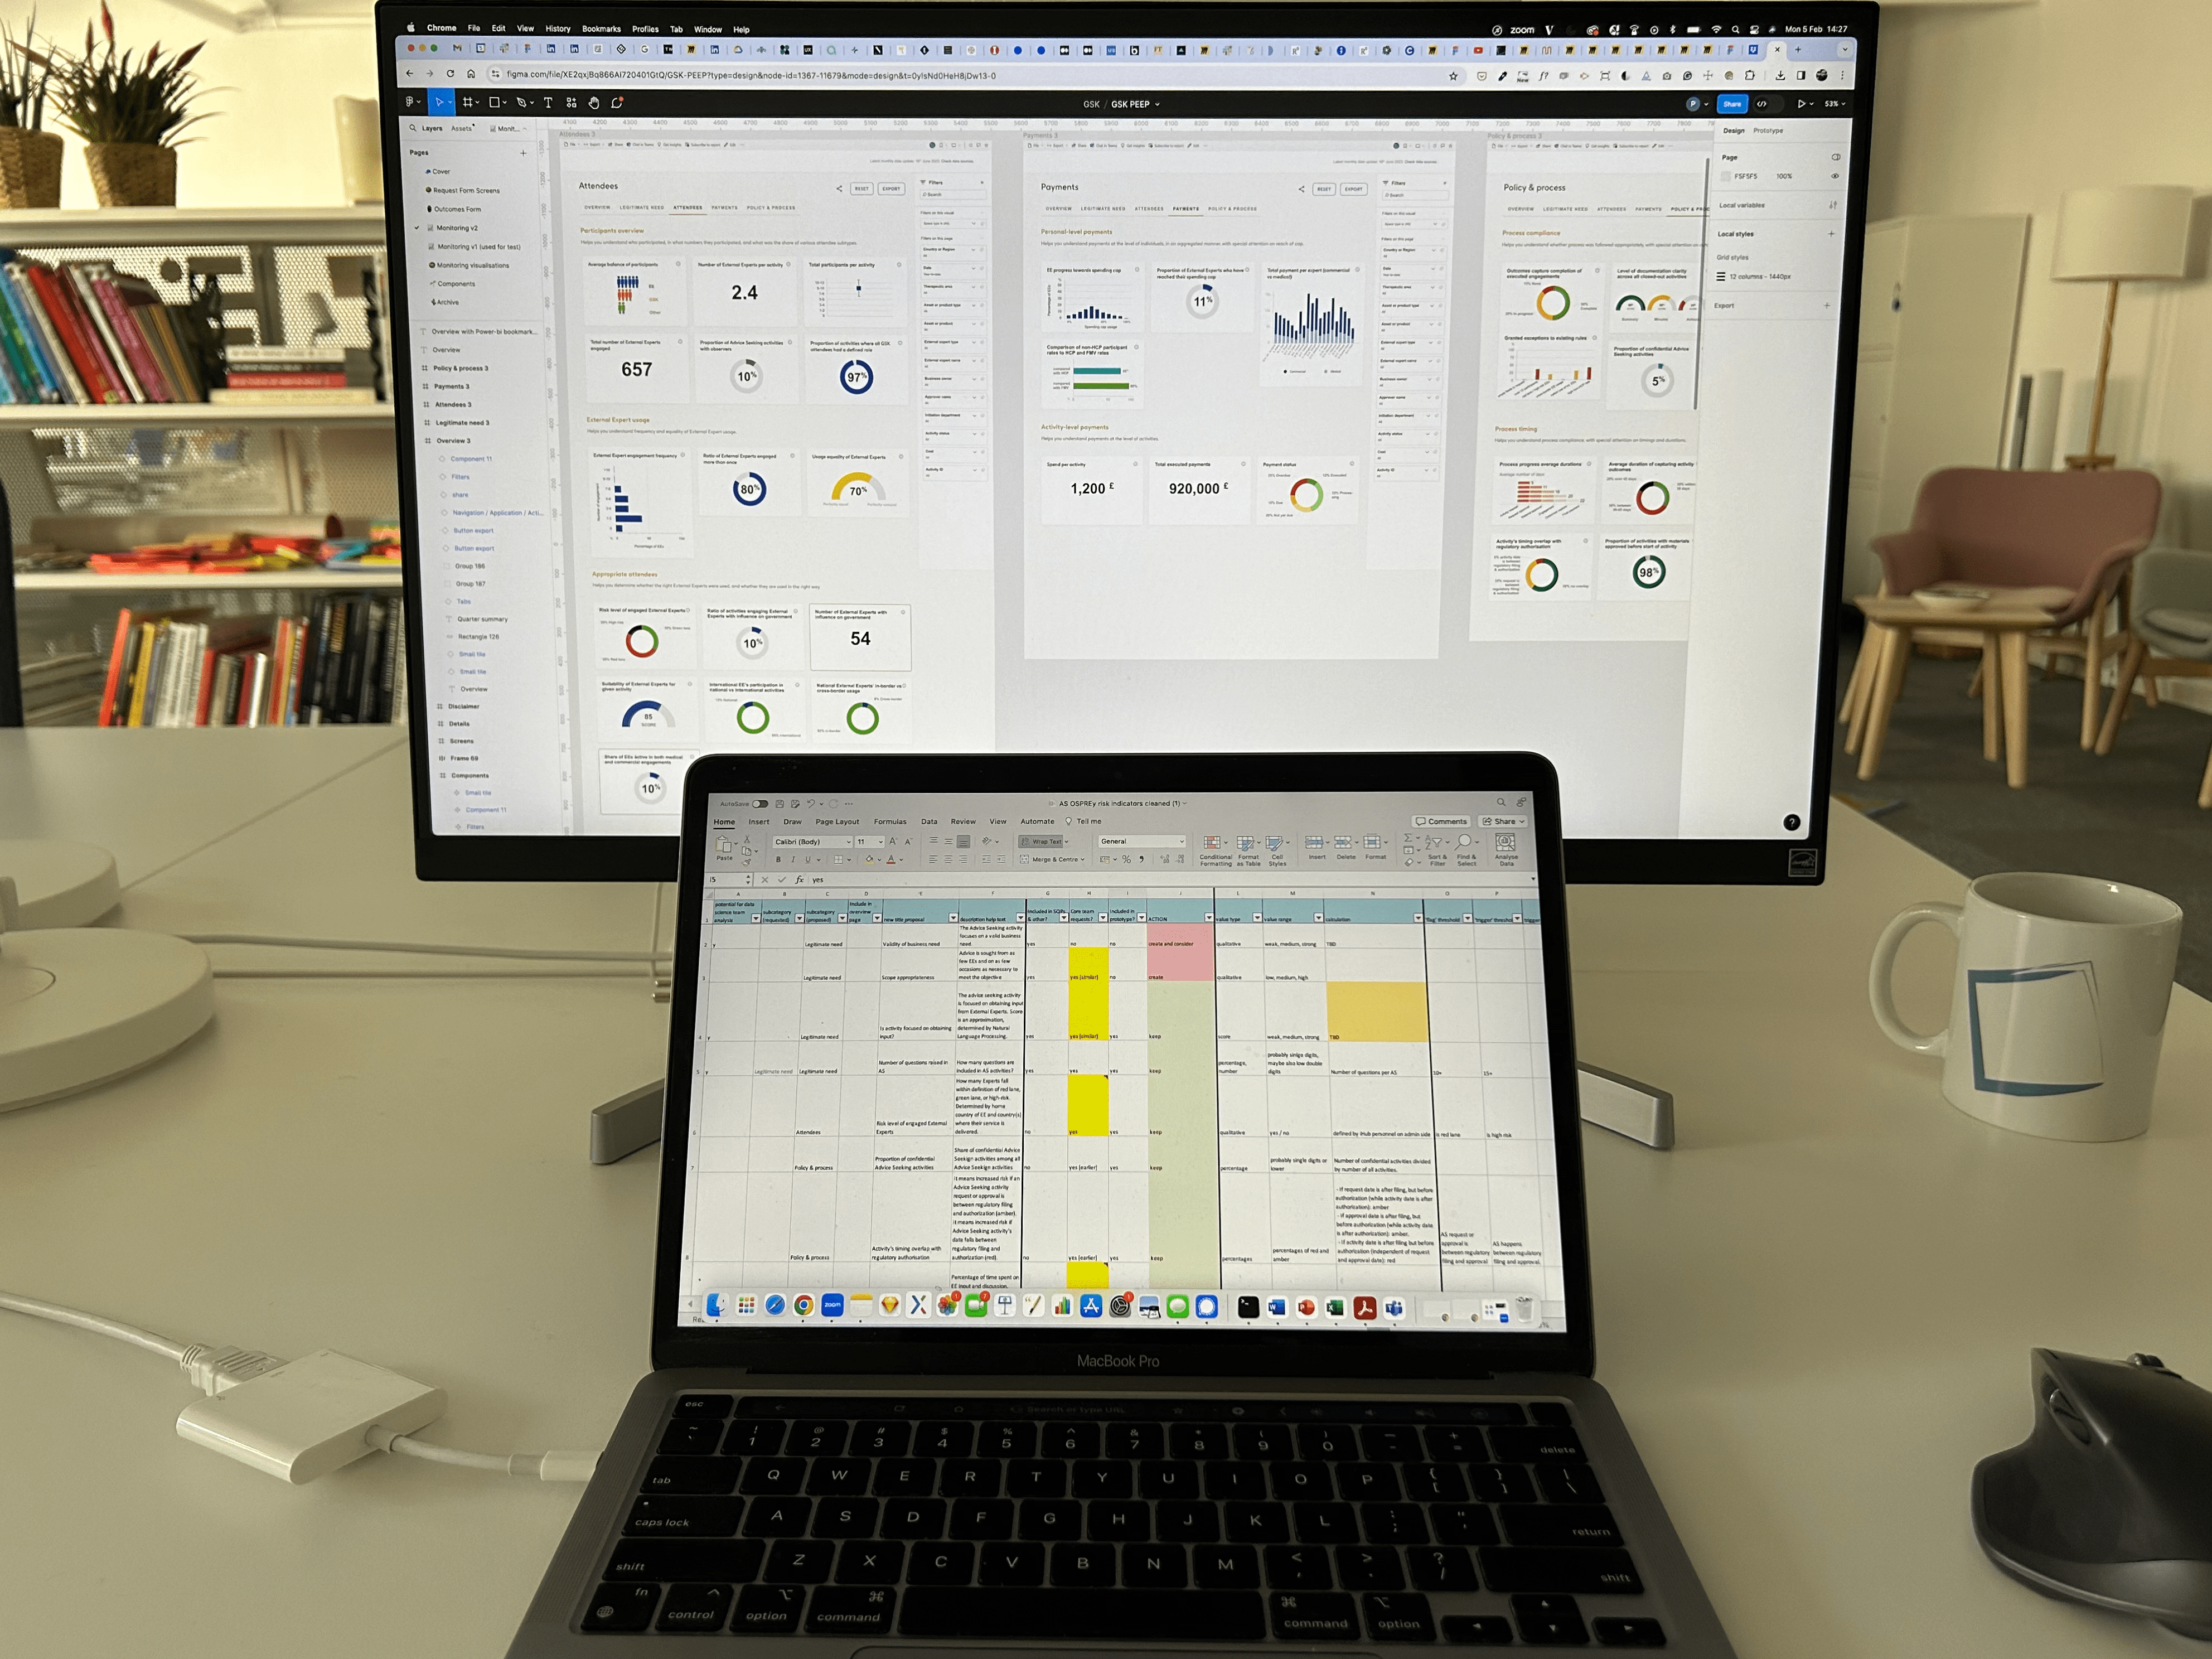
- translating each business need into an ideal visualization (including the exact chart type and its variables)
- defining exact data points for it (including trigger thresholds)
- identifying the source of existing data points
- defining ways of capturing the missing data points
We even went beyond simply displaying data. Building on our previous engagements with the client, we linked up the project team with an Advanced Data Analytics team from another department, and explored machine learning opportunities to:
- translate data into text-based summaries
- provide actionable insights
- and create forecasts based on historical data
A well-rounded package
Working together with the many business and technical counterparts on the client’s side, we created a structured project deliverable that included:
- prioritized development backlog, including user stories and success metrics for each story, spanning everything from API calls to user controls
- a detailed visualization including individual chart types, as well as their development prioritization
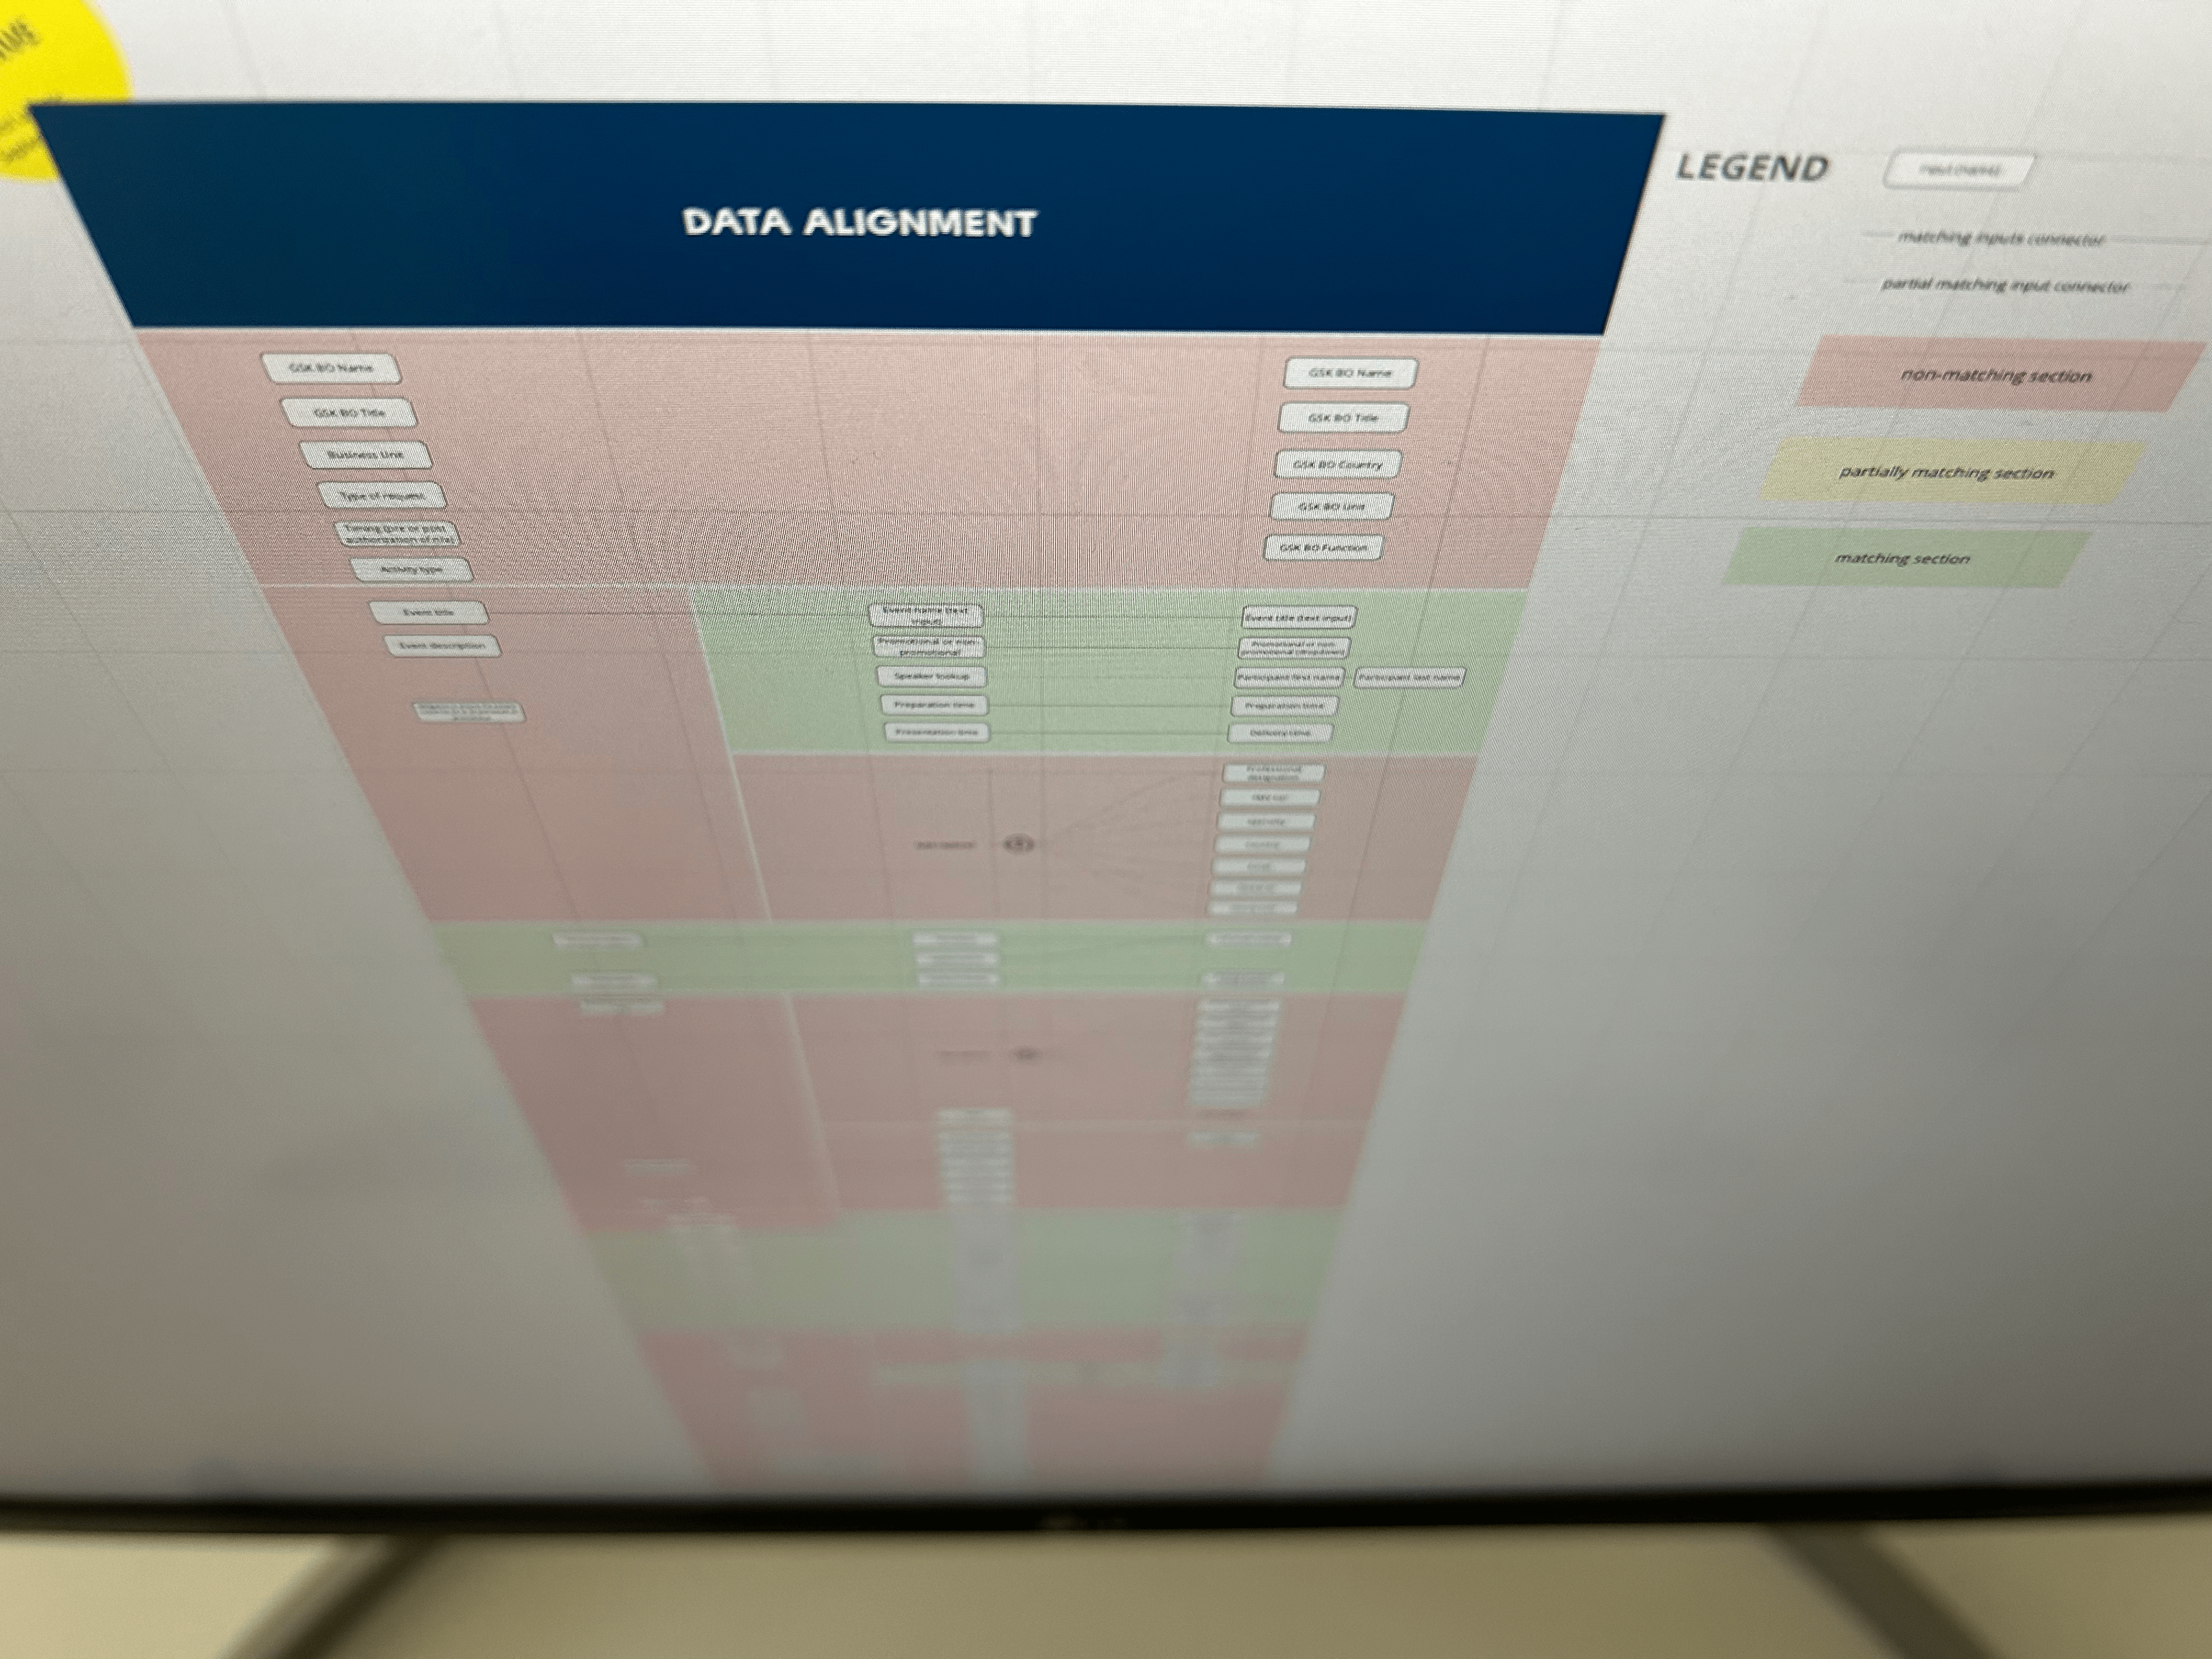
- a data repository to align previously independent systems that needed to be combined for our final system
Our deliverables would help create an easy-to-consume and actionable oversight dashboard for managers, as well as an easy-to-use global knowledge repository for subject matter experts.

Peter Horvath
Strategy & Service Design Lead
It was excellent to grow our involvement together with the maturation of the project and be a truly integrated part of the client team. Finding technical and business integration and automation possibilities where nobody sought them before was really fulfilling.

More from our portfolio

Your work here?


